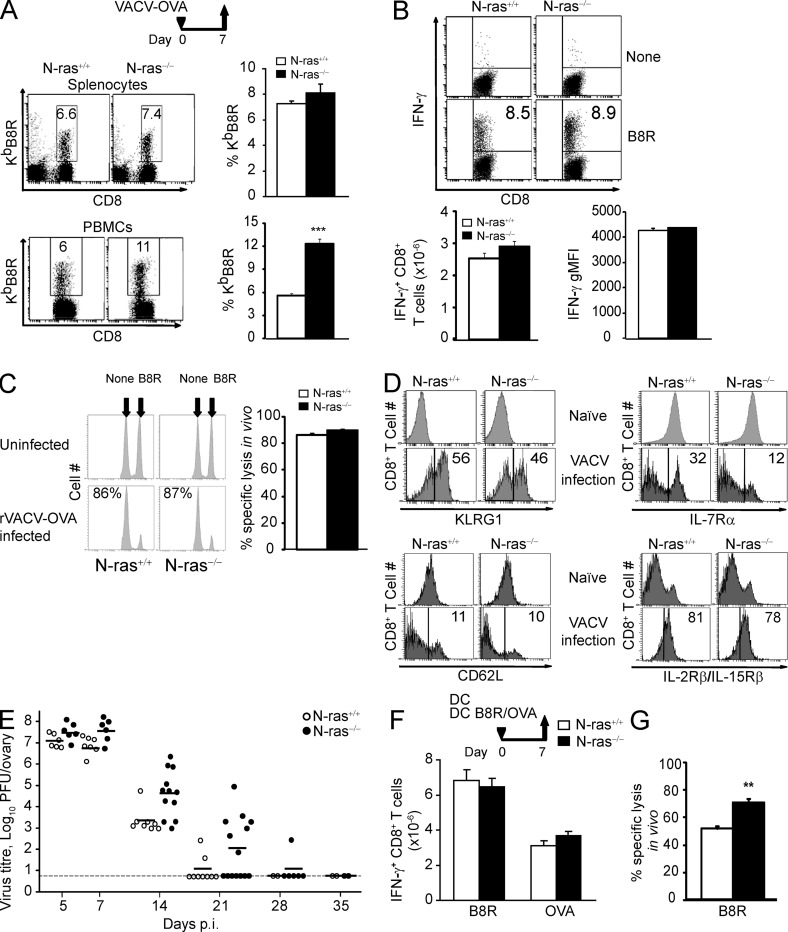
Figure 2.
N-ras–deficient mice mount efficient primary CD8+ T lymphocyte effector responses after VACV infection and after DC immunization. WT and N-ras−/− mice were i.p. infected with rVACV-OVA (A–E) or immunized with a mixture of mDC loaded with B8R and OVA peptides (F and G). On day 7 p.i., splenocytes and PBMCs were harvested and the frequency of B8R-specific T cells within the CD8+ population (A) and the number of B8R-specific splenic CD8+ T cells producing IFN-γ, as well as their geometric MFI of IFN-γ expression, were determined ex vivo (B; n = 4, 2 experiments; results are expressed as mean ± SEM). ***, P < 0.0005. (C) In vivo function of day 7 p.i. primary CD8+ T lymphocytes was assessed in in vivo killing assays (n = 5, two experiments). The numbers in the histograms indicate the percentage of specific lysis. Results are expressed as mean ± SEM. (D) On day 7 p.i., surface expression of KLRG1, IL-7Rα (CD127), CD62L, and IL-2Rβ/IL-15Rβ (CD122) in CD8+ splenocytes from naive mice or in CD8+, H-2KbB8R+ splenocytes from infected mice was measured and a representative histogram per molecule is shown. The numbers within the histograms indicate the percentage of cells. (E) Infectious virus titer in the ovary was determined on the indicated days p.i. Dots represent titers for each individual ovary and the horizontal dashes represent the mean for each time point. Detection limit is indicated by the long horizontal line. (F and G) On day 7 after DC immunization, the number of B8R-and OVA-specific splenic CD8+ T cells producing IFN-γ were determined ex vivo as in B (n = 5, two experiments; F) and in vivo killing assays were performed as in C (n = 5, two experiments; G). **, P < 0.005. Results (F and G) are expressed as mean ± SEM.

