Figure 4.
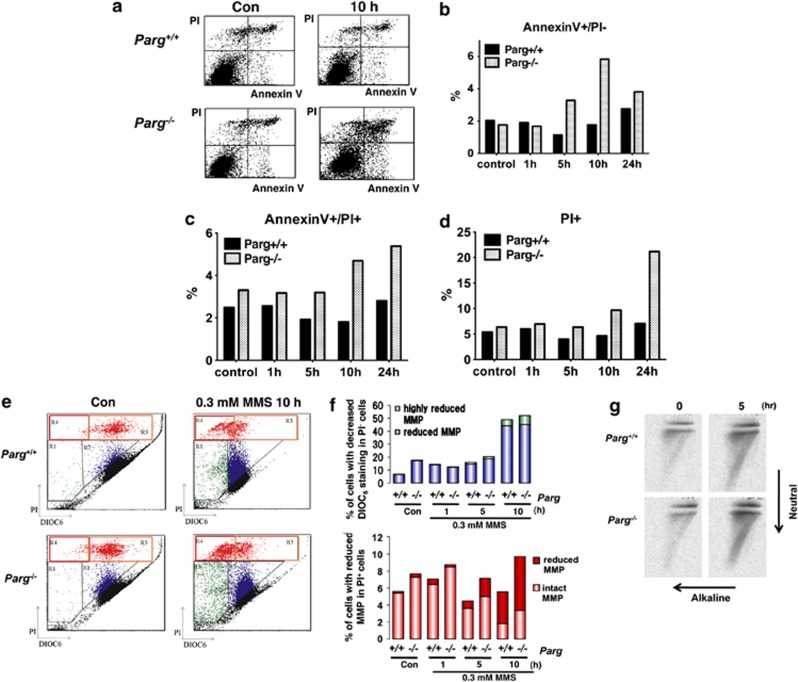
Early and late changes in plasma membrane and mitochondrial membrane potential in ES cells after treatment with 0.3 mM MMS. (a) Time-course analysis of changes in plasma membrane integrity using propidium iodide (PI) and annexin V staining. Percentage of PI-positive (b), Annexin V-positive and PI-negative (c), and annexin V-positive and PI-positive fractions (d). Representative data are shown. (e and f) Mitochondrial membrane potential was measured by DIOC6 staining. (g) Two-dimensional electrophoresis is performed in one dimension under neutral conditions to analyze DSBs, and then in a second dimension under alkaline conditions to analyze single strand lesions. Fragmentation of mitochondrial DNA was then examined using a probe for the mitochondria-specific gene, ND1

