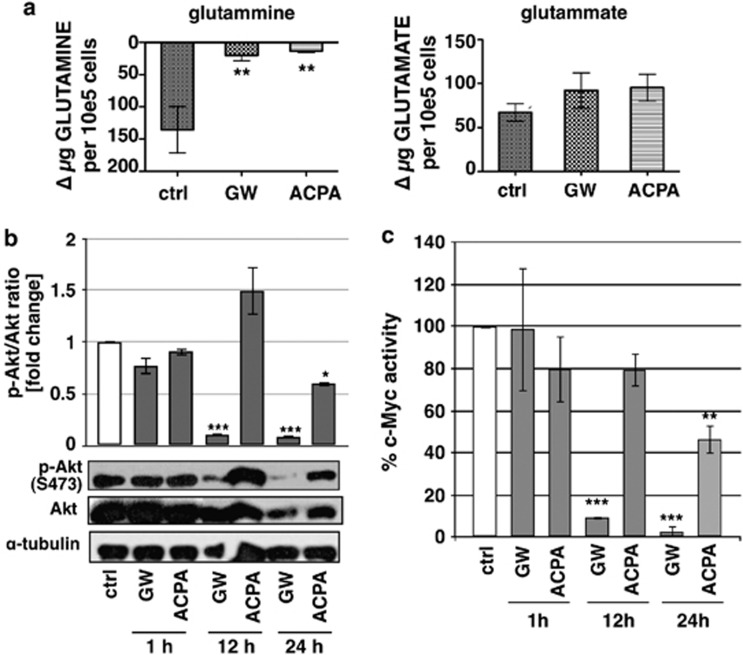
Figure 6.
Effect of cannabinoids on glutamine metabolism. (a) The analyses of glutamine uptake and glutamate release were performed after treatment of Panc1 cells for 12 h with 200 μM GW or ACPA. (b) Western blot analysis was performed using total protein extracts of Panc1 cells treated for 1, 12 and 24 h with 200 μM GW or ACPA. The bands were scanned as digital peaks and the areas of the peaks were calculated in arbitrary units, as described in Materials and Methods. The value of α-tubulin was used as a normalizing factor and quantifications represent the ratio phosphorylated/total protein. Values are the means of three independent experiments (±S.D.). (c) C-Myc activity was analysed after treatment for 1, 12 and 24 h with 200 μM GW or ACPA. Values are the means of three independent experiments (±S.D.). Statistical analysis: *P<0.05, **P<0.01, and ***P<0.001

