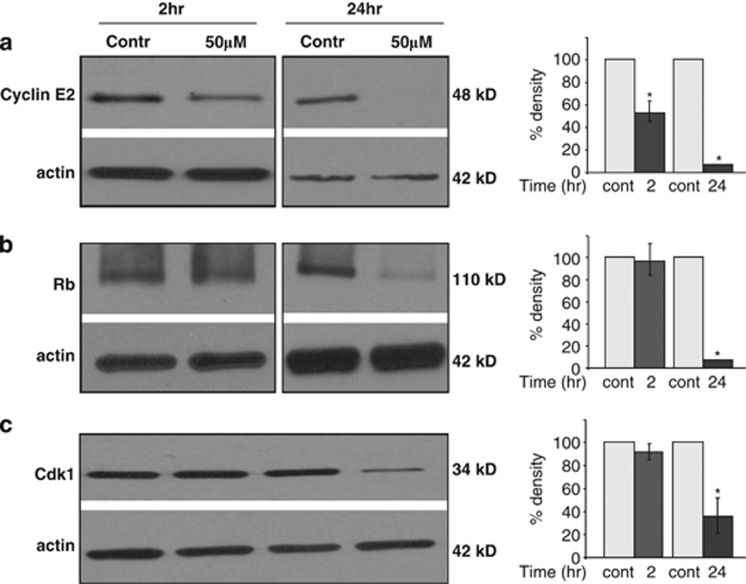
Figure 4.
(a) Western blot analyses indicating the effects of NS1643 treatment on cyclin E2, (b) Rb and (c) Cdk1. Each protein expression is represented graphically (right panel) upon 2 or 24 h treatment with NS1643 (dark gray bars; n=3; *P<0.05) and compared with control (C2 or C24, light gray bars; n=3) or 24 h treatment. The chart shows the average total optical density of the specific protein band from the densitometric analysis of immunoblots expressed as percentage change of control. Data were normalized to protein expression levels present in cells with no drug added

