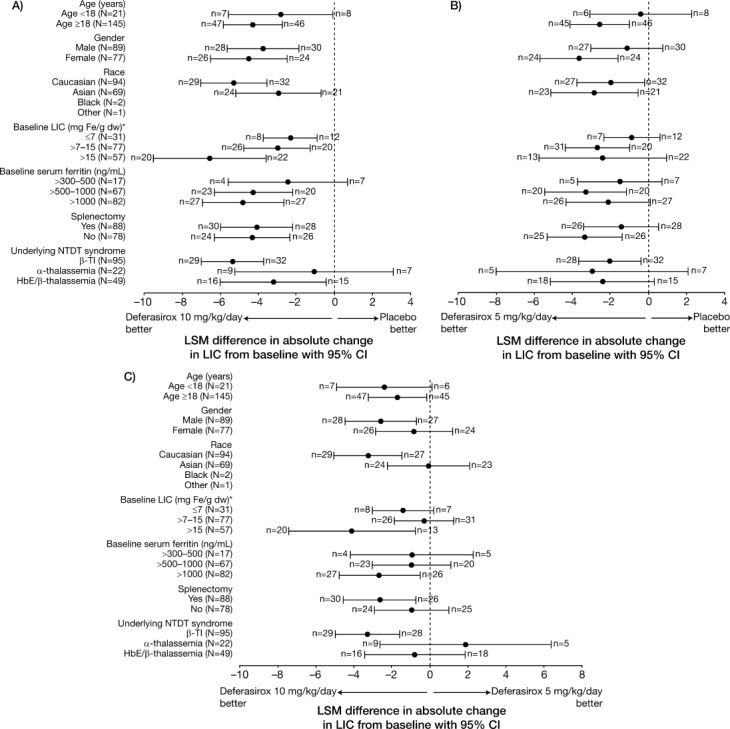
Figure 1.

Forest plots of LSM with 95% confidence interval (CI) for differences in absolute change in LIC from baseline to Week 52 between (A) deferasirox 10 mg/kg/day starting dose and all placebo groups combined; (B) deferasirox 5 mg/kg/day starting dose and placebo groups; and (C) deferasirox 5 mg/kg/day and deferasirox 10 mg/kg/day starting dose groups. *n = 1 missing.
