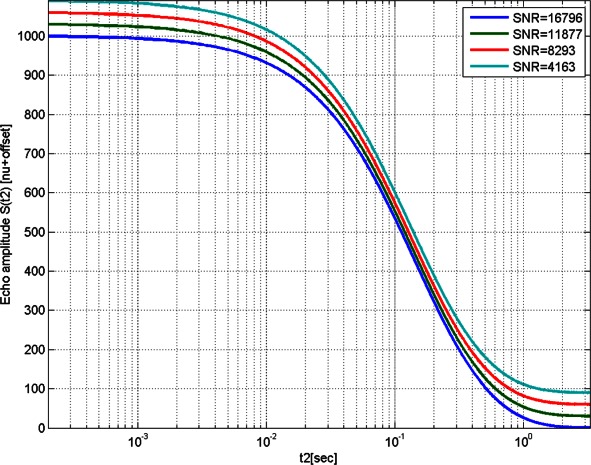
Figure 7.

Logarithmic plot of the combined time-domain signals of a rapeseed oil sample acquired using 64, 32, 16, and 4 scans. For each NS value, only one representative signal and its SNR value are shown. The echo amplitude of each signal was normalized to its highest value, and an offset was added to each relaxation curve for simplicity of comparison.
