Figure 8.

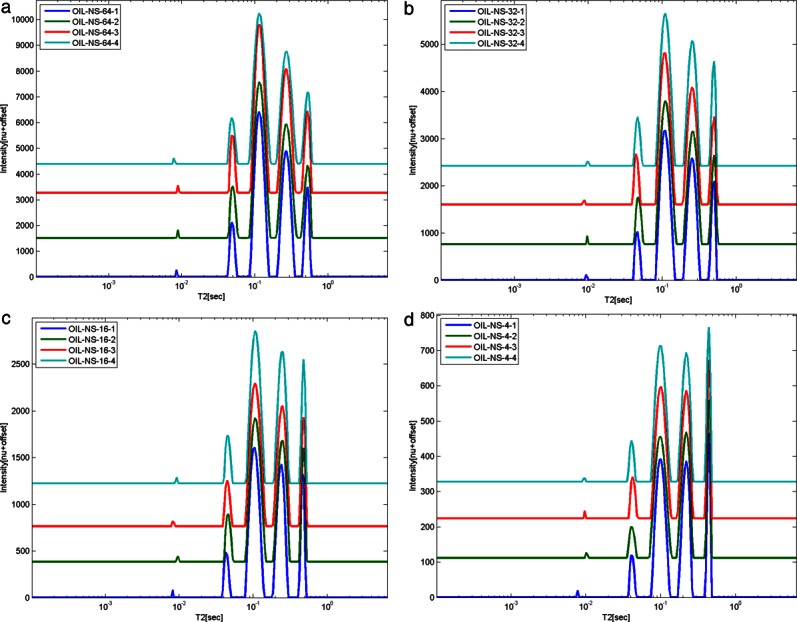
Relaxation time distributions analyzed using less conservative PDCO (α2 = 0.5) on the same real LR-NMR dataset acquired from a rapeseed oil sample. The results are ordered (a)–(d) by descending number of scans (descending SNR).

Relaxation time distributions analyzed using less conservative PDCO (α2 = 0.5) on the same real LR-NMR dataset acquired from a rapeseed oil sample. The results are ordered (a)–(d) by descending number of scans (descending SNR).