
FIGURE 4.
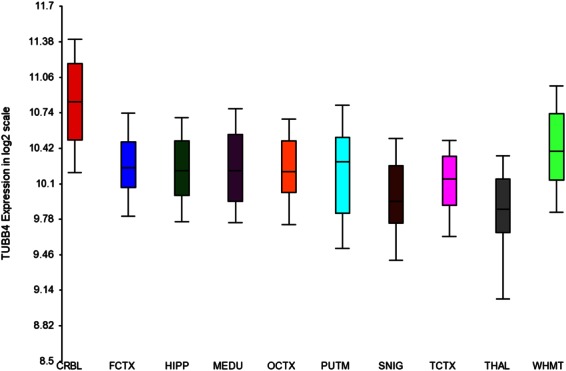
Graph of the expression of the TUBB4a gene in 10 brain regions from 134 normal individuals, assessed using the Affymetrix Exon 1.0 ST Array. The level of TUBB4a is given as a log scale with range bars. This showed very high expression in the cerebellum and in the brain overall. The following areas were studied: cerebellum (CRBL), frontal cortex (FCTX), hippocampus (HIPP), medulla (MEDU), occipital cortex (OCTX), putamen (PUTM), substantia nigra (SNIG), temporal cortex (TCTX), thalamus (THAL), and white matter (WHMT). [Color figure can be viewed in the online issue, which is available at http://www.annalsofneurology.org.]