
FIGURE 5.
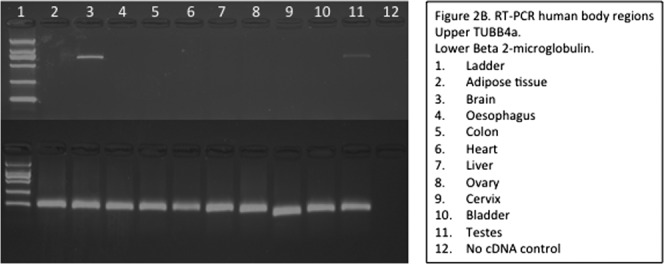
Expression of TUBB4a (top row) in various human tissues was determined by reverse transcriptase polymerase chain reaction using gene-specific primers against cDNA generated from tissue-specific RNA as compared to the housekeeping gene beta2-microglobulin (bottom row). Expression was high in the brain and very low in other tissues, except for moderate expression in the testes. 1 = ladder; 2 = adipose tissue; 3 = brain; 4 = esophagus; 5 = colon; 6 = heart; 7 = liver; 8 = ovary; 9 = cervix; 10 = bladder; 11 = testes; 12 = no cDNA control.