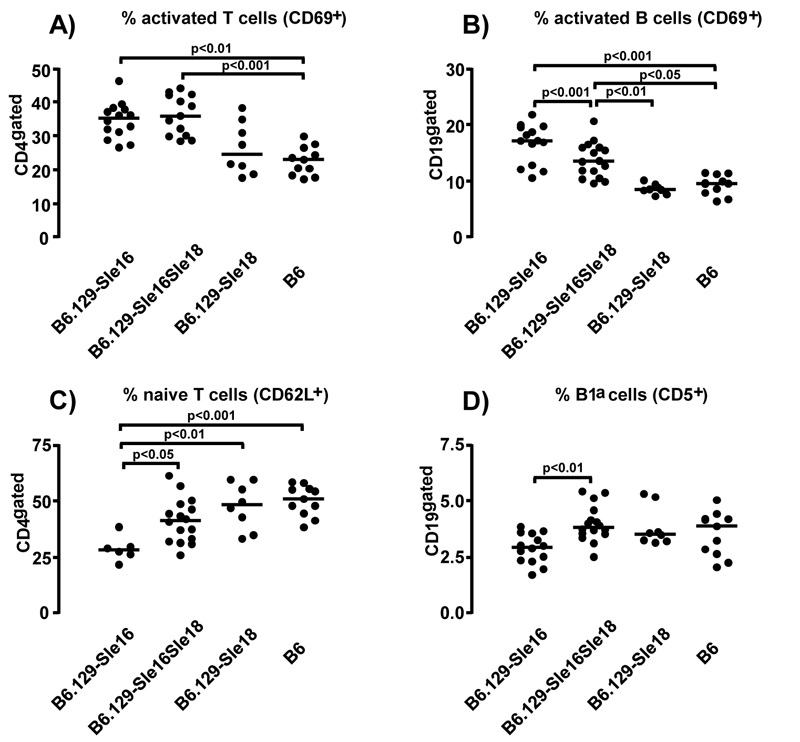
Figure 3.
Lymphocyte population distribution in the spleens of 12 month-old mice. The percentage of activated CD69+ T cell (A) and B cells (B) are shown. Graphs illustrating the proportion of (C) naive CD4+ T cells (CD62L+) and (D) of B1a cells (CD19+CD5+) are presented. For each panel all significant differences, determined by the Kruskal-Wallis test with Dunn’s multiple comparison test, are indicated. Each symbol represents one mouse and the horizontal lines designate means.

