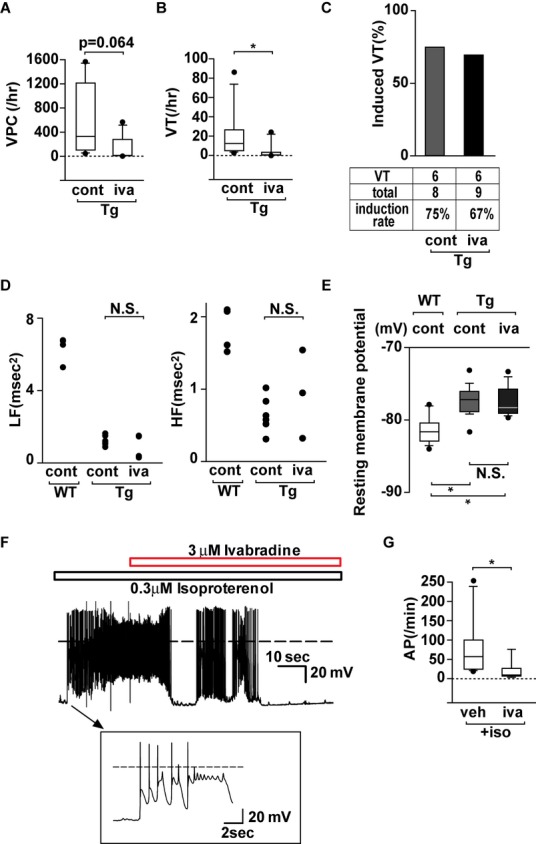
Figure 5.

Ivabradine (iva) reduces arrhythmicity in dnNRSF‐Tg (Tg) hearts. A and B, Numbers of PVCs (A) and VTs (B) recorded using a telemetry system in Tg mice treated with or without iva. Data are shown as box plots. Mann–Whitney test was used for analysis. *P<0.05 (n=7 for Tg without iva, 6 for Tg with iva). C, Frequency of mice with inducible VTs during intracardiac electrophysiology studies among Tg mice treated for 12 weeks with or without iva. VT, numbers of mice with inducible VT; total, total numbers of mice tested. D, Average power of the low frequency (LF) and high frequency (HF) components of HRVs recorded over a 24‐hour period in untreated WT and Tg mice treated with or without iva. Mice treated without iva are indicated as cont. n=4 for WT without iva, n=6 for Tg without iva, n=4 for Tg with iva. Kruskal–Wallis nonparametric ANOVA followed by Bonferroni correction was used for the analysis. Data are shown as dot plots. E, Average resting membrane potentials recorded from ventricular myocytes isolated from 20‐week‐old untreated WT and Tg mice treated with or without iva: Kruskal–Wallis nonparametric ANOVA followed by the Bonferroni correction was used for the analysis. NS, not significant. *P<0.0166 vs WT (n=12 for untreated WT, 12 for untreated Tg, 14 for Tg with iva). Mice treated without iva are indicated as cont. Data are shown as box plots. F, Representative traces showing that ivabradine (3 μmol/L) reduces the frequency of spontaneous action potentials in the presence of isoproterenol (0.3 μmol/L) are shown. Arrows show larger pictures of action potentials. G, Graphs show numbers of spontaneous action potentials in the presence of isoproterenol (0.3 μmol/L) in ventricular myocytes from dnNRSF‐Tg in the absence (veh) or presence of iva. Shown are the numbers of spontaneous action potentials (AP/min) occurring in the presence of isoproterenol (0.3 μmol/L) during the second minute after addition of iva or vehicle (veh). Data are shown as box plots. Mann–Whitney test was used for the analysis (n=6 for control and 5 for iva). *P<0.05. NS indicates not significant; dnNRSF‐Tg indicates dominant‐negative form of neuron‐restrictive silencer factor transgenic mice; PVC, premature ventricular contraction; VT, ventricular tachycardia; ANOVA, analysis of variance; WT, wild type; cont, control; HRV, heart rate variability.
