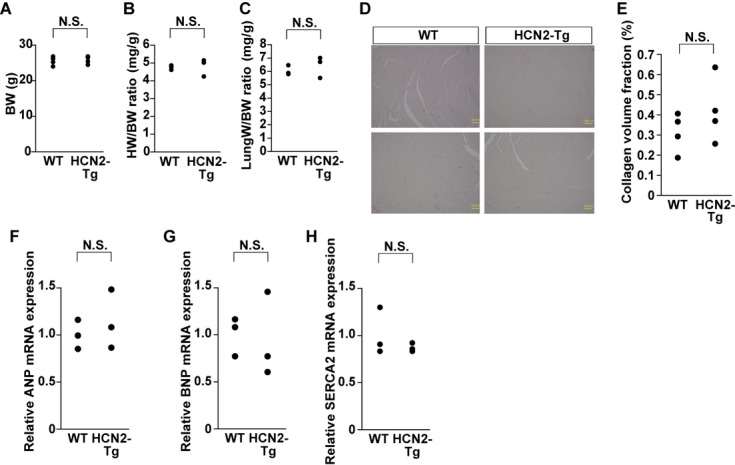
Figure 7.

Features of cardiac‐specific HCN2‐Tg mice. A through C, Body weights (BW) (A), heart weight‐to‐body weight ratios (HW/BW) (B) and lung‐to‐body weight ratios (LW/BW) (C) in 12‐week‐old WT and HCN2‐Tg mice are shown as dot plots (for BWs, n=4 for each group; for HW/BW ratios, n=3 for each group; and for LW/BW ratios, n=3 for each group). The Mann–Whitney test was used for the comparison between WT and HCN2‐Tg. NS, not significant. D, Histology of WT and HCN2‐Tg hearts from 12‐week‐old mice: Sirius‐red staining. Magnification, ×400; scale bars, 100 μm. E, Graph showing the the percentage of collagen area in WT and HCN2‐Tg mice (n=4 for each group). The Mann–Whitney test was used for the analysis. NS, not significant. Data are shown as dot plots. F through H, Relative levels of ANP (F), BNP (G), and SERCA2 (H) mRNA in hearts from 12‐week‐old WT and HCN2‐Tg mice (n=3 in each group). The Mann–Whitney test was used for the analysis. NS, not significant. Data are shown as dot plots in F through H. HCN2‐Tg indicates hyperpolarization‐activated cyclic nucleotide‐gated channel 2 transgenic mice; WT, wild type.
