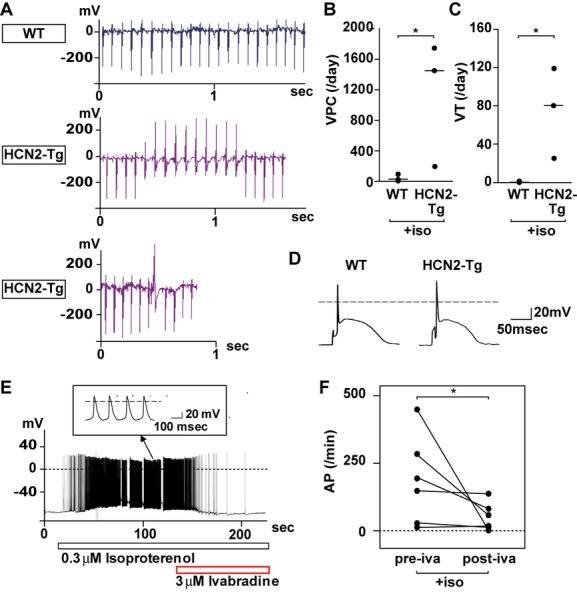
Figure 9.

β‐adrenergic stimulation‐induced ventricular arrhythmias in HCN2‐Tg hearts. A, Representative ECG traces showing sinus rhythm in WT mice treated with isoproterenol (upper panel) and ventricular tachycardia (VT) with atrioventricular dissociation (middle panel) and isolated PVC (lower panel) in HCN2‐Tg mice treated with isoproterenol. B and C, Numbers of isolated PVCs (B) and VTs (C) recorded using a telemetry system in WT and HCN2‐Tg mice treated with isoproterenol (iso). Mann–Whitney test was used for the analysis. *P<0.05 (n=3 for each group). D, Representative traces of action potentials recorded in ventricular myocytes isolated from WT and HCN2‐Tg hearts. E, Representative traces of spontaneous action potentials in ventricular myocytes from HCN2‐Tg hearts recorded in the presence of 0.3 μmol/L isoproterenol, to which 3 μmol/L ivabradine was subsequently added, as indicated. Arrows show larger pictures of action potentials. F, Graph showing the numbers of spontaneous action potentials (AP) in the presence of 0.3 μmol/L isoproterenol (iso) in ventricular myocytes from HCN2‐Tg mice with or without 3 μmol/L ivabradine (iva). The Wilcoxon signed‐rank test was used for the analysis. Shown are the numbers of action potentials occurring during the minute just before (pre‐iva) and the second minute after (post‐iva) addition of ivabradine. *P<0.05 (n=6). HCN2‐Tg indicates hyperpolarization‐activated cyclic nucleotide‐gated channel 2 transgenic mice; WT, wild type; PVC, premature ventricular contraction.
