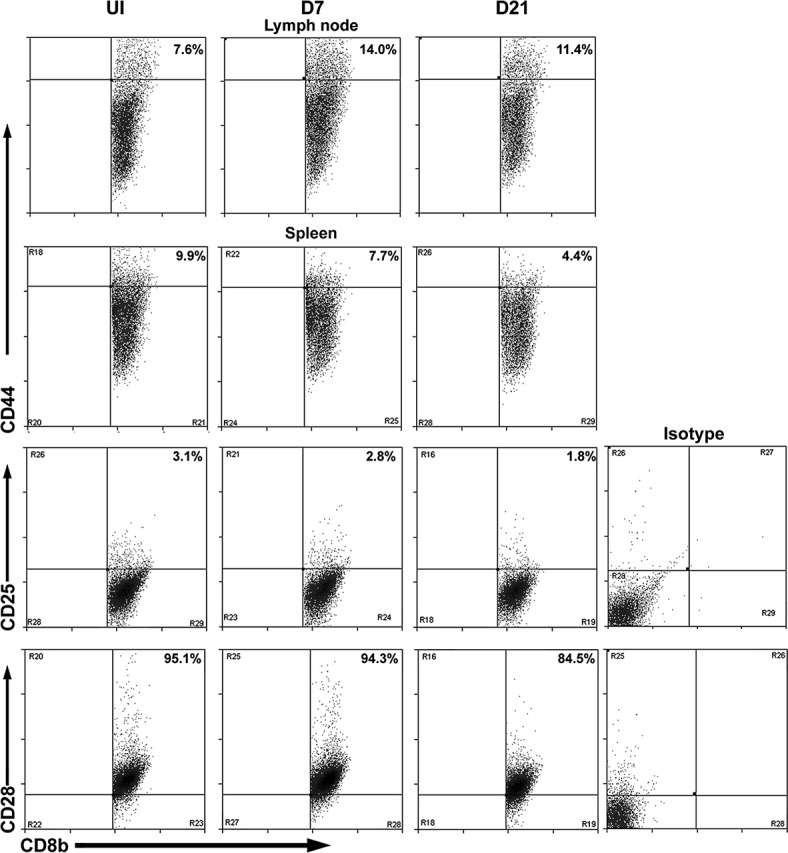
Figure 1.

Characterization of CD8+ T‐cell response to arterial injury in CD4−/− mice. Representative scatter plots of activation markers CD44, CD25, and CD28 assessed in lymph node (top row) and spleen (second, third, and bottom rows) in uninjured mice (UI, left column) or 7 and 21 days after injury (D7 and D21, middle and right columns, respectively). The CD8b+ (FITC) gate was used for cell analysis. CD44, CD25, and CD28 antibodies were PE conjugated. FITC indicates fluorescein isothiocyanate; PE, phycoerythrin.
