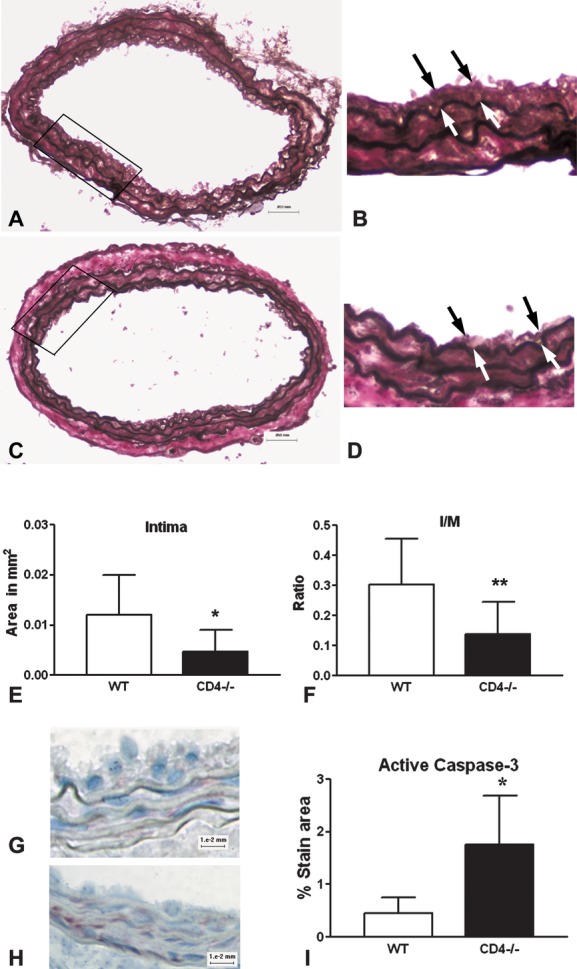
Figure 2.

Neointima formation after arterial injury. Representative sections with elastin Von Geison stain 21 days after injury in wild‐type (WT) (A and B) and CD4−/− (C and D) mice. Bar graph of area measurements for intima (E) and intima‐to‐media (I/M) ratio (F). *P=0.01; **P=0.007; WT, n=12; CD4−/−, n=11. Bar=50 μm; (B) and (D) are ×40 magnification. Representative sections stained for active caspase‐3 from WT (G) and CD4−/− (H) mice. Bar=10 μm. Histomorphometric analysis of percent active caspase‐3‐stained area (I). *P=0.04; n=4 each.
