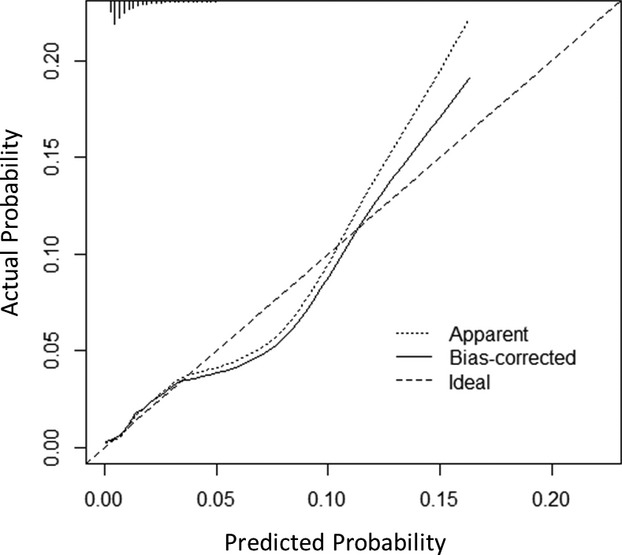
Figure 1.

Observed vs predicted rates of vascular complications. This figure depicts observed (y‐axis) vs predicted (x‐axis) vascular access site complications in patients undergoing percutaneous coronary intervention (PCI) via transfemoral access. The bias‐corrected line represents the adjusted calibration curve accounting for optimism, as assessed by bootstrap validation. Differences in observed and predicted rates of events were small across all levels of risk (Hosmer–Lemeshow P=0.42).
