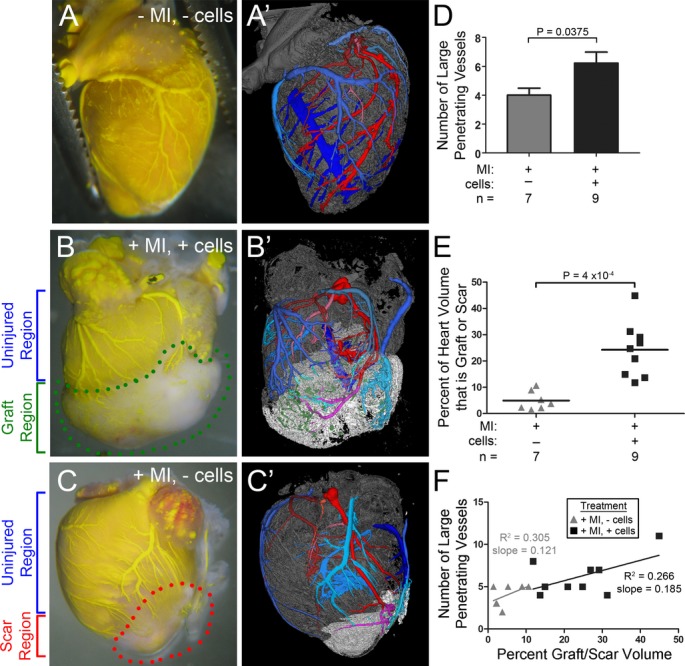
Figure 1.

Visualization of the coronary networks reveals vessels within the graft and scar. Brightfield images (A, B, C) and 3D renderings (A', B', C') of hearts perfused with yellow Microfil 28 days after no treatment (A), infarction and cell engraftment (B), or infarction only (C). Graft (B, within green dotted circle) and scar (C, within red dotted line) appear whiter relative to the uninjured myocardium. For 3D renderings (A', B', C'), graft tissue is white, uninjured cardiac tissue is gray. Arteries are shades of red, veins are shades of blue, undefined vessels are green. Vessels change color when entering the graft or scar. Vessels extend from the host tissue into both the graft (B, B') and scar (C, C'). Numerous vessels of various sizes and of both arterial and venous origin are present in both the graft and scar regions. D, More vessels penetrate the grafts than scars. Values are the average total number of large arteries and veins entering/exiting the graft or scar (see Table 1). Error bars are SEM; P=0.0375 by unpaired t test. E, Graph of graft and scar size, as measured by μCT, shown as percent of the whole 3D heart volume. P=4 × 10⁻⁴ by unpaired t test. F, Plot of graft or scar size versus the number of large vessels that invade the graft or scar. Linear regression analysis reveals that larger grafts and scars have a higher number of large invading vessels (including both arteries and veins). The best‐fit lines from both data sets have similar slopes, suggesting that the number of large vessels induced to invade and perfuse a graft or scar area is dependent upon the volume of that area. MI indicates myocardial infarction; μCT, microcomputed tomography
