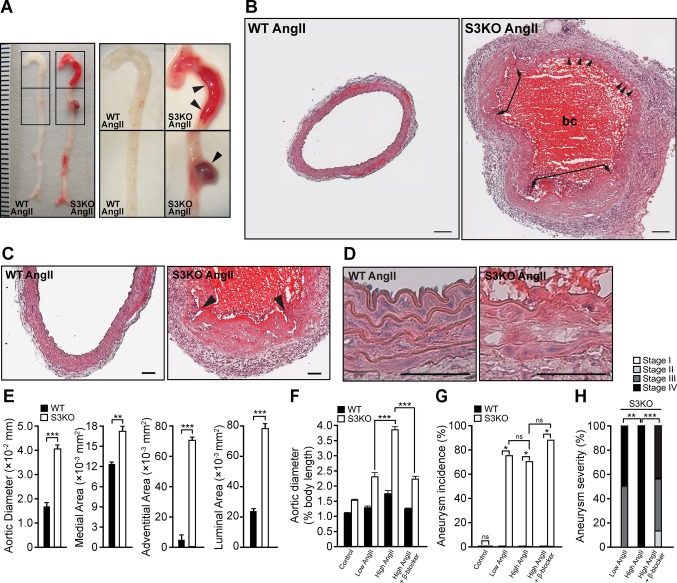
Figure 2.
Aortic aneurysm formation in AngII‐infused S3KO mice. A, Gross phenotype of WT and S3KO aorta. Boxed regions on the left panels were magnified and are shown on the right panels. Arrowheads indicate aortic aneurysms. Each division on the ruler represents 1 mm. B, Hematoxylin and eosin staining of WT and aneurysmal S3KO aorta after AngII infusion. Representative image of the aorta was captured at the same anatomical location in both groups. Arrowheads indicate dissection tears within the medial layer. Double‐arrowed connectors indicate the regions where a complete breakage of elastin lamella occurs. Scale bars=200 μm. C and D, Hematoxylin and eosin staining showing disruption of elastic lamella (arrowheads) (C) and medial dissection (D) in S3KO aneurysmal aorta. Scale bars=100 μm. E, Morphometric analysis of the aorta (n=5 per group). F through H, Changes in aortic diameter (F), aneurysm incidence (G), and severity (H) after low‐dose (n=8 per group) and high‐dose (n=10 per group) AngII and β‐blocker (n=8 per group) treatments. Note that differences in aortic diameter between WT and S3KO were significant (P<0.001) for control and treatment groups but are not indicated. Values represent mean±SEM. **P<0.01, ***P<0.001. AngII indicates angiotensin II; WT, wild type; S3KO, SMAD3 knockout; bc, blood clot; ns, not significant.

