Figure 8.
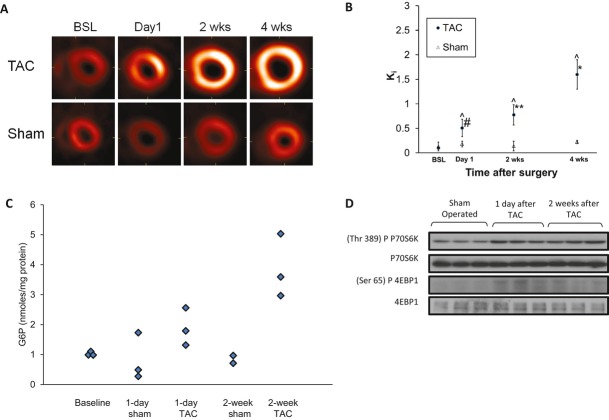
Metabolic remodeling and mTOR activation precede structural remodeling in hearts subjected to high workload in vivo. A, Representative serial transverse, end‐diastolic PET slices for TAC and sham‐operated mice 1 day, 2 weeks, and 4 weeks after surgery. One day after TAC, there was an increase in FDG uptake that increased further over 4 weeks. B, Quantification of the rate of cardiac FDG uptake (Ki) of PET images from all TAC (n=8) and sham‐operated (n=5) mice. Data shown are mean±SEM. Ki in TAC mice demonstrated a 5‐fold increase in FDG uptake on day 1 and a 1.5‐ to 3.2‐fold increase from day 1 to 4 weeks. Sham‐operated mice showed no significant change in FDG uptake over 4 weeks. Comparisons at different times within TAC group: day 1 vs baseline (BSL), #P<0.05; 2 weeks vs BSL or day 1, **P<0.05; 4 weeks vs BSL, day 1, or 2 weeks, *P<0.001. Comparisons between TAC and sham groups at the same points, ^P<0.05. C, Tissue G6P levels in hearts after TAC or sham operation at baseline and after 1 day and 2 weeks. Dot plots of G6P levels for each group; n=6 for TAC and n=5 for sham. G6P levels were 2.3‐ and 4.6‐fold higher compared with sham‐operated animals 1 day and 2 weeks after TAC, respectively. Kruskal–Wallis test yielded overall P=0.0356. D, Representative Western blots demonstrated an increase in p70S6K and 4EBP1 phosphorylation 1 day and 2 weeks after TAC. mTOR indicates mammalian target of rapamycin; PET, positron emission tomography; TAC, transverse aortic constriction; FDG, 2‐deoxy, 2[18F]fluorodeoxy‐glucose.

