
FIGURE 2—
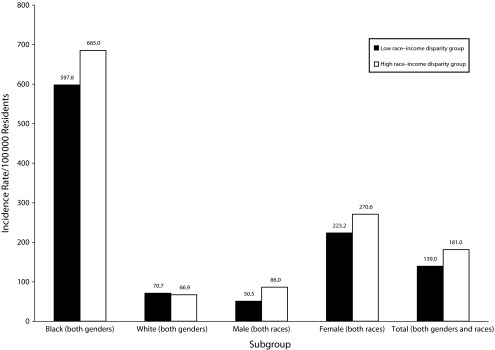
Chlamydia incidence rates (per 100 000 residents) for high and low race–income disparity groups by race and gender: United States, 1999–2001.
Note. Because the computed rates were for the entire population for each group, we did not perform significance tests.