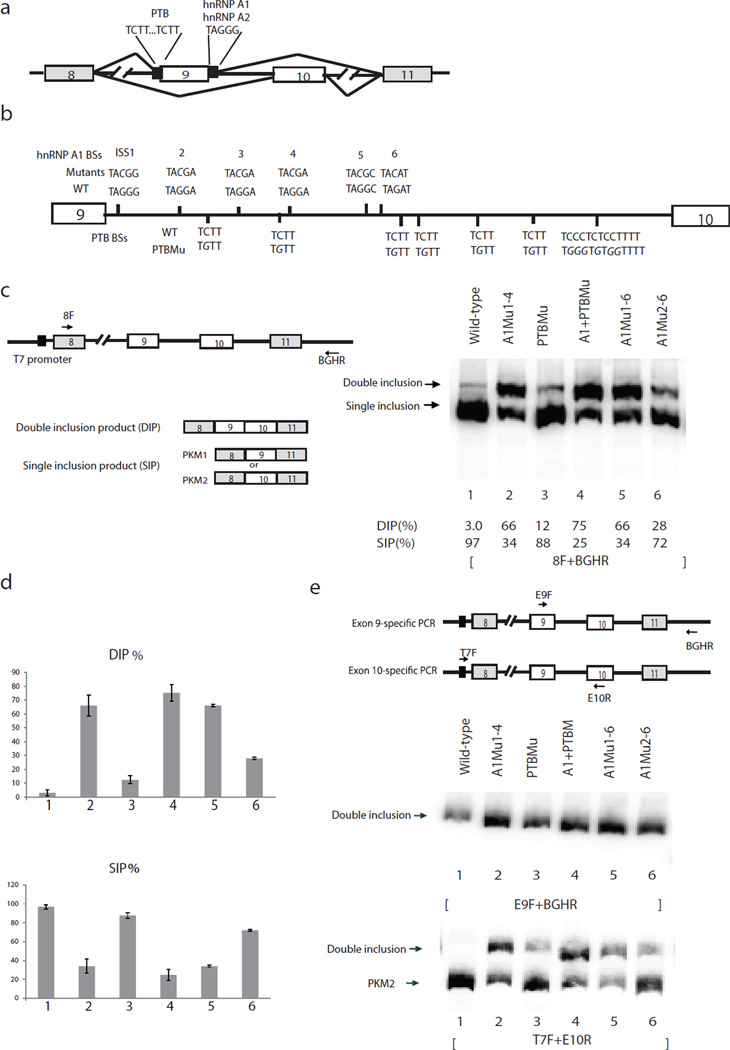
Figure 1.
Mutations of intron 9 sequences derepress exon 9 inclusion. (a) Schematic diagram of PKM splicing construct containing exon 8 to exon 11. “//” indicates deletions of intron sequences. Mutually exclusive AS of exon 9 and exon 10 is indicated. Solid black boxes flanking exon 9 indicate binding sites for hnRNP A1/A2 and PTB, described previously10. (b) Schematic diagram of PKM intron 9. Vertical lines indicate putative A1/A2 (above the line indicating intron 9) and PTB (below the line) binding sites (BSs). Mutations of BSs are indicated above or below wild-type BSs in italic. (c) Schematic diagram of splicing construct and possible products are indicated on the left panel. Black arrows indicate primers used to amplify PKM AS products. RT−PCR assays of RNA isolated from transient transfections of wild-type and mutated splicing constructs. The positions of splicing products are indicated on the left. The percentages of DIP (DIP(%)) and SIP (SIP(%)) in total products (DIP(%))are indicated under the lane numbers. (d) Bar graphs show percentages of DIP (left) and SIP (right) using wild-type and mutated splicing constructs with standard deviation, n=3. Lane numbers correspond to lane numbers in panel. DIP, double inclusion product. SIP, single inclusion product. c, and the same lane numbers represent the same constructs. (e) Left panel, scheme indicates positions of exon 9- and exon 10-specific primers. E9F, which anneals to exon 9, and vector-specific primer BGHR were used to amplify exon 9-containing products. Vector-specific primer T7F and E10R were used to amplify exon 10-containing products. Right, RT-PCR assays with primers that amplify only exon 9-containing products to analyze splicing products from intron 9-mutated splicing constructs. Splicing constructs are indicated above, and splicing products are indicated on the left. Lane numbers correspond to those in panel c, and the same lane numbers represent the same constructs.

