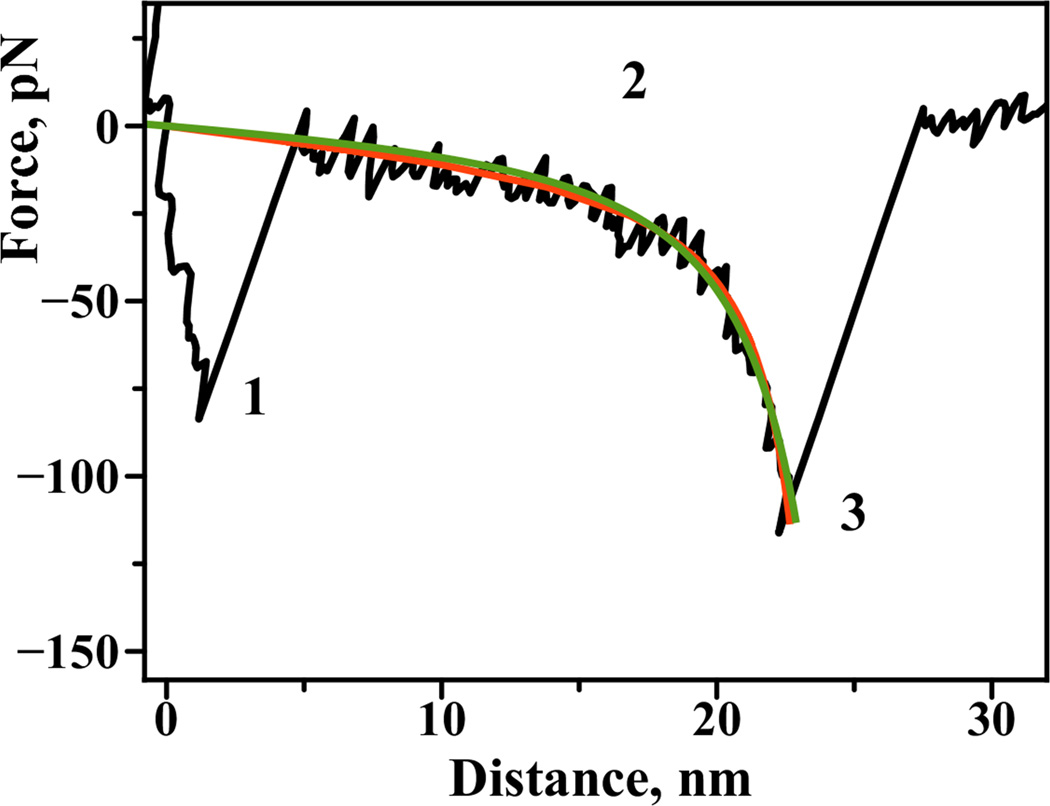
Figure 2.
A typical force–distance curve obtained for the interactions between complementary DNA strands in a single tether approach: 1) Short-range adhesion peak due to nonspecific interactions between the surface and the tip of the probe, 2) this region is indicative of polymer linker stretching, 3) specific rupture peak. Region 2 of the curve is fitted with a) worm-like chain polymer model (WLC, continuous green line) and b) freely-jointed chain polymer model for comparison (FJC, continuous red line). Both models provide a good fit with the following residual RMS values: 6.9 pN for WLC model and 6.7 pN for FJC model.

