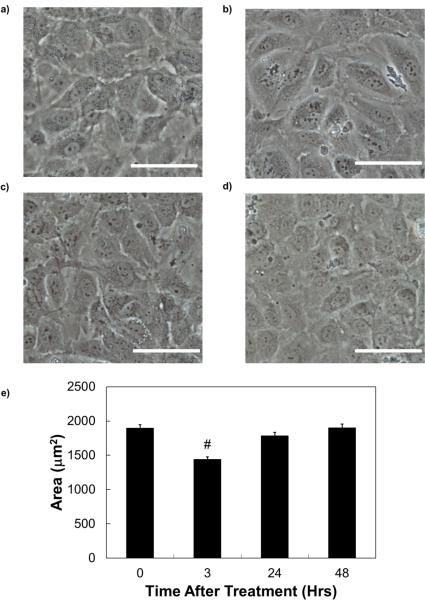
Fig. 4.
Phase contrast images of hCB-ECs a) before H2O2 treatment; b) at the end of the 3 hour incubation with H2O2; c) 24 hours after the onset of the incubation with H2O2; d) 48 hours after the onset of the incubation with H2O2; and e) EC area at these time points. There was a change in cell morphology and area after exposure for 3 hours, but cells returned to the morphology of the control condition after 24 and 48 hours. Scale bar = 40μm.

