Figure 2 (A, B).

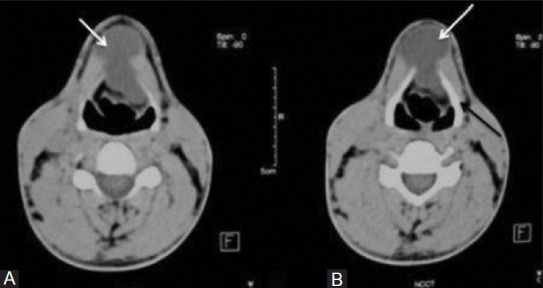
Thyroglossal duct cyst: Axial non-contrast CT images show midline cystic (white arrows) mass (A) just above and (B) at the level of hyoid bone (black arrow)

Thyroglossal duct cyst: Axial non-contrast CT images show midline cystic (white arrows) mass (A) just above and (B) at the level of hyoid bone (black arrow)