Figure 4 (A, B).

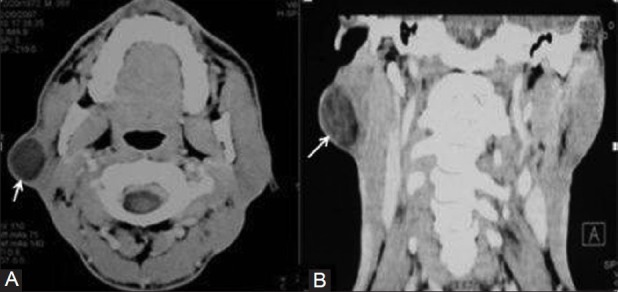
First branchial cleft cyst: (A) Axial and (B) coronal contrast enhanced CT images show a well defined hypodense mass (arrows) within the right parotid gland

First branchial cleft cyst: (A) Axial and (B) coronal contrast enhanced CT images show a well defined hypodense mass (arrows) within the right parotid gland