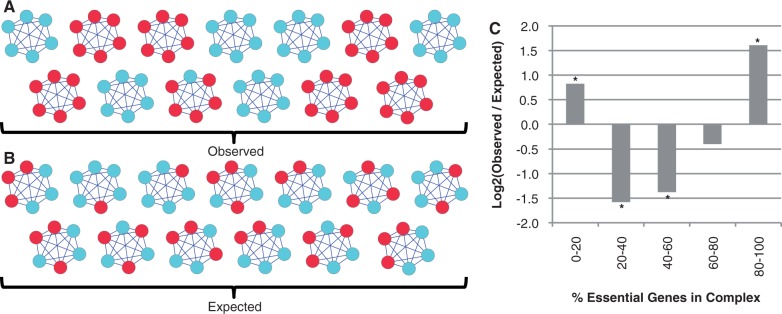
Fig. 1.—

Comparing the observed distribution of essential genes in Saccharomyces cerevisiae to that expected at random. (A) Distribution of essential genes among complexes in S. cerevisiae. For clarity, only nonoverlapping complexes with six subunits are shown. Essential genes are shown in red, nonessential in blue. (B) An example of randomly distributed essential genes among the same set of complexes shown in (A). (C) Comparing the observed distribution of essential genes in complexes to that seen in 1,000 randomizations (see Materials and Methods). The log 2 ratio of observed to expected is shown here; positive values indicate observed frequency above random, and negative values indicate frequency below random. Stars indicate values that are more extreme than those seen in any of the randomizations.
