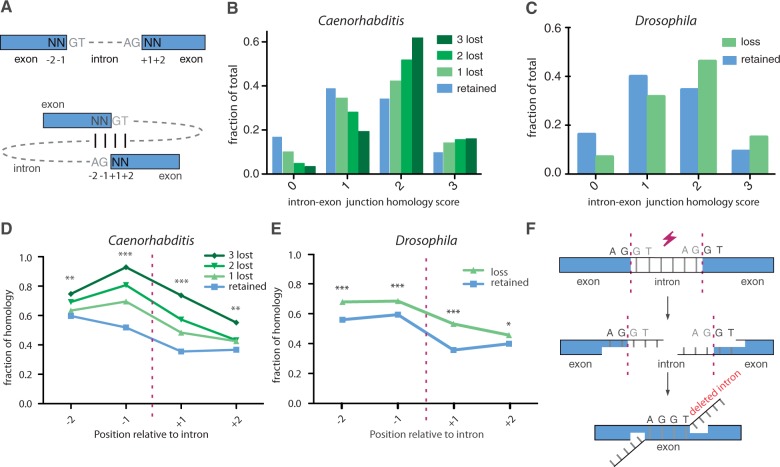
Fig. 2.—
MMIL. (A) Schematic representation of the intron–exon junction alignment. For all intronic positions, the degree of homology was determined by comparing the consensus splice donor nucleotides GT to the 2 outermost 5′-nucleotides of the 3′ exon and the consensus acceptor nucleotides AG to the 2 outermost 3′-nucleotides of the 5′ exon. Identical nucleotides scored 1, nonidentical scored 0. Noncoding wobble bases were omitted; hence, the score window is maximized to 3. (B) The degree of intron–exon junction homology for intronic positions that suffered from 0, 1, 2, or 3 cases of intron loss. χ2 test (df = 3) was used to compare zero-lost group (n = 73,853) with the groups containing one loss (n = 1,832): P < 0.001, two losses (n = 528): P < 0.001, and three losses (n = 120): P < 0.001. (C) The degree of intron/exon junction homology for Drosophila intronic positions that suffered from zero (n = 99,864) or one or more (n = 1,385) losses (χ2 test, df = 3, P < 0.001). Homology scores for individual nucleotide positions as depicted in figure 3A for (D) Caenorhabditis and (E) Drosophila. *P < 0.05, **P < 0.01 and ***P < 0.001. (F) A microhomology-mediated end-joining mechanism for intron loss.

