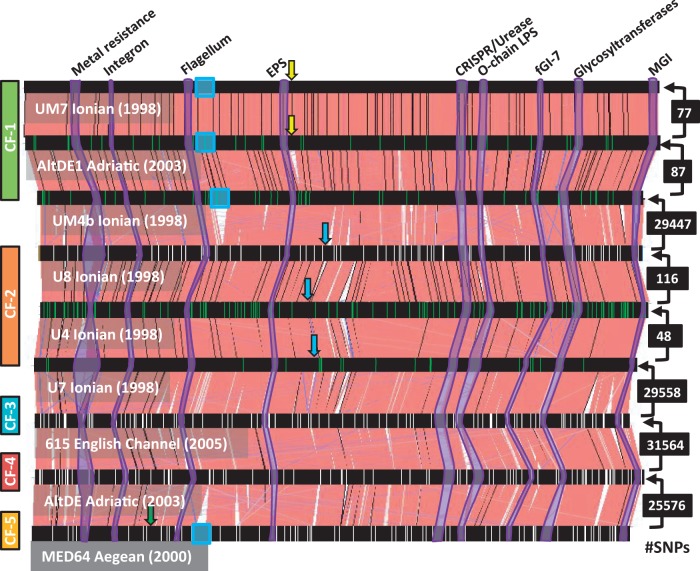
Fig. 1.—
Alignment of Alteromonas macleodii deep ecotype available genomes. They are arranged by numbers of SNPs along their core genomes starting from the bottom genome of MED64. Numbers of SNPs are indicated to the right and the amount corresponds to the comparison of the two strains connected by the arrow. Vertical green lines indicate SNPs among the strains within a CF, whereas white ones mark genes with ratio dN/dS > 1 between pairs of strains belonging to different CFs. Colored rectangles to the left delineate the genomes belonging to the same CF. Arrows show location of lysogenic phages inserted within the genomes, same color indicate same phage. ICEs are highlighted with blue rectangles. Some fGIs identified in the comparison between AltDE and AltDE1 (Gonzaga et al. 2012) have been highlighted in purple, identified by the inferred function (on top).

