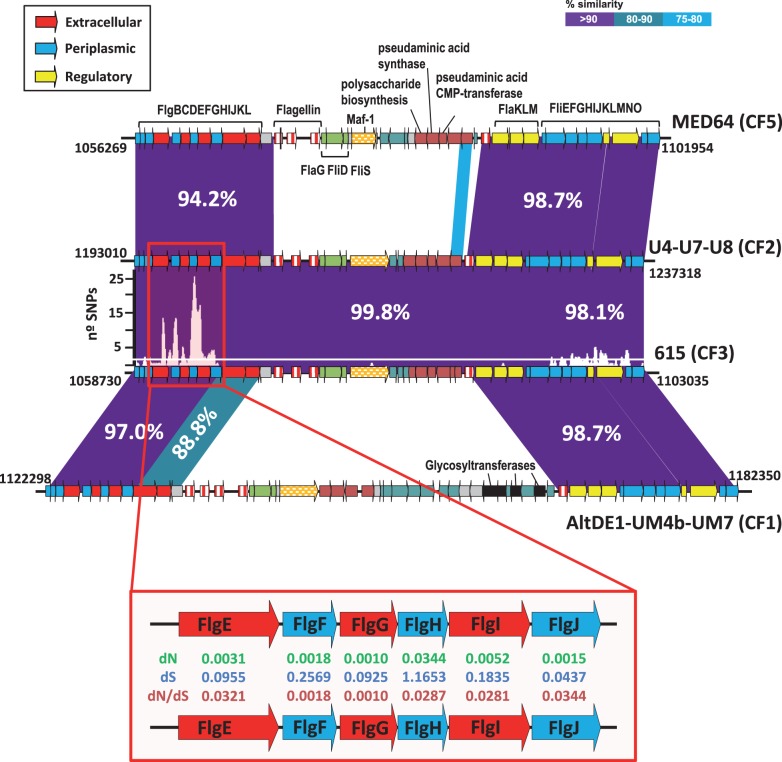
Fig. 3.—
Comparison of the gene cluster involved in the biosynthesis and assembly of flagellar components, with the flagellum glycosylation island fGI found in different CFs. The plots above the 615 cluster indicate number of SNPs in a 100-bp window when compared with the three CF2 strains (all identical over this fGI). The average number of SNPs in the genome is indicated by the white line. The region enlarged in the red box indicates the rate of nonsynonymous (dN), synonymous (dS) substitutions and the dN/dS ratios.

