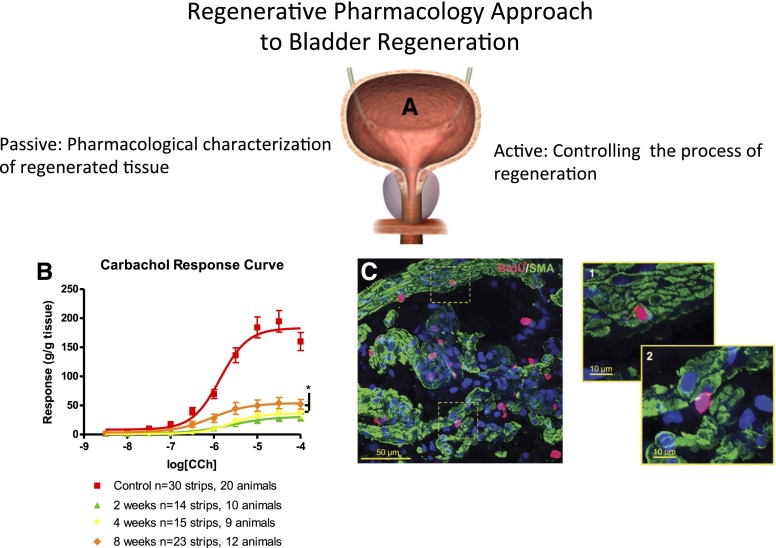
Fig. 4.
Application of pharmacology to bladder regeneration. (A) Representative illustration of the bladder. (B) Representative concentration-response curve data (CRC) for carbachol (CCh)-induced steady-state contractions of isolated bladder strips obtained from regenerating rat bladders at 2, 4, and 8 weeks post-STC (subtotal cystectomy; modified from Burmeister et al., 2010; see for more details). In short, carbachol dose–response curves are from both control animals and at 2, 4, and 8 weeks post-STC. Responses have been normalized to strip weight. Total area under the curve values were 312.8 for controls, 54.65 at 2 weeks, 61.86 at 4 weeks, and 119.7 at 8 weeks post-STC. Maximal steady-state (Emax) values for all STC animals are significantly lower than control tissue (P < 0.001). Emax values at 8 weeks post-STC are significantly higher than 2 and 4 week time points (P < 0.05). As illustrated, the data reveal a time-dependent increase in the magnitude of carbachol-induced contractile response. Note that although the contractile response never fully recovered from the initial injury, the animals were continent (i.e., the bladder emptied normally). Such observations highlight the importance of pharmacology analyses in general and, in this instance, signal transduction mechanisms in particular, in the evaluation of regeneration. Understanding the mechanisms and characteristics of functional recovery will be a key to designing improved therapeutics for bladder and organ regeneration in the future. (C) Colocalization in cells of incorporated BrdU (bromodeoxyuridine), indicative of proliferation, and specific markers for smooth muscle (SMA, smooth muscle actin) in the muscularis propria (MP) of the regenerating bladder of a female rat [the panel was reproduced from Peyton et al. (2012); additional details can be found in the manuscript as well]. Confocal z-stack reconstruction imaging was performed at 600× magnification, where offset pictures are digitally zoomed. The images were obtained from sections 7 days post-STC and reflect the early proliferative response of the rat bladder. BrdU-SMA colabeling was observed within the MP (C-1), but was relatively rare. BrdU-labeled cells within the MP were more commonly observed between smooth muscle cells as well as smooth muscle bundles (C-2).

