
Figure 1.
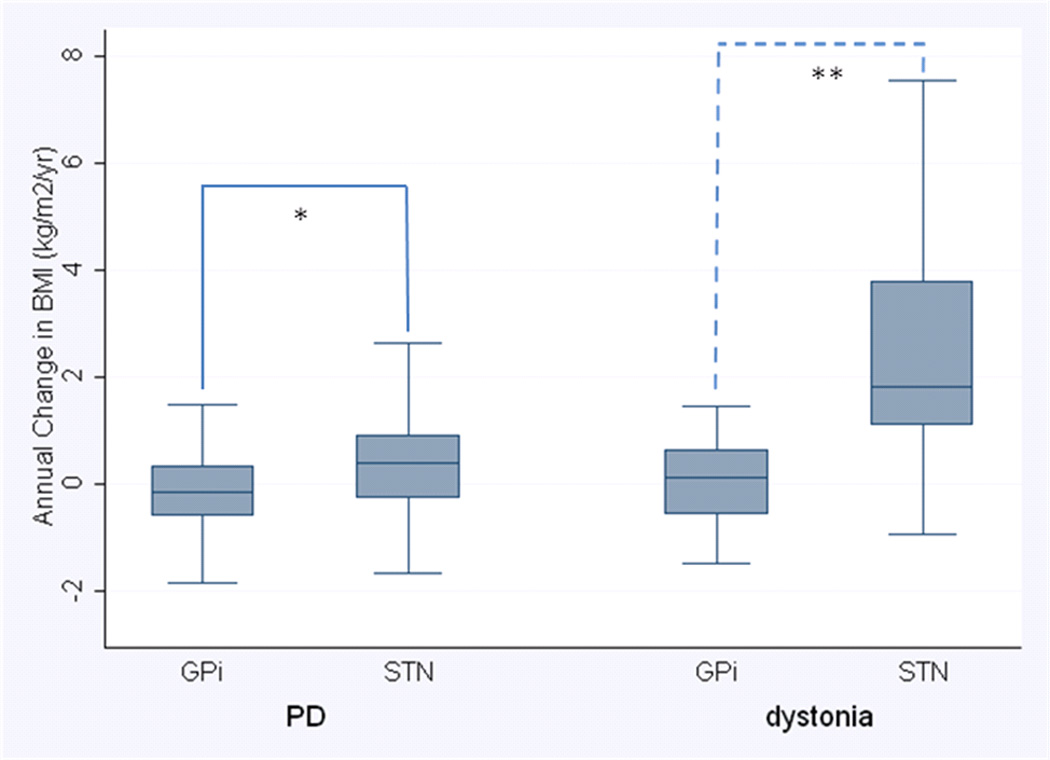
Annual change in BMI after DBS surgery, stratified by disease and surgical target.
Disease-specific differences in median annual BMI change between targets were evaluated with Wilcoxon rank-sum test (*p=0.037, **p=0.020). Median is indicated by black center line, and the inter-quartile range (first and third quartiles) are the edges of the box. Whiskers denote 1.5 × the IQR from the nearest quartile. PD = Parkinson’s disease, GPi = globus pallidus internus, STN = subthalamic nucleus