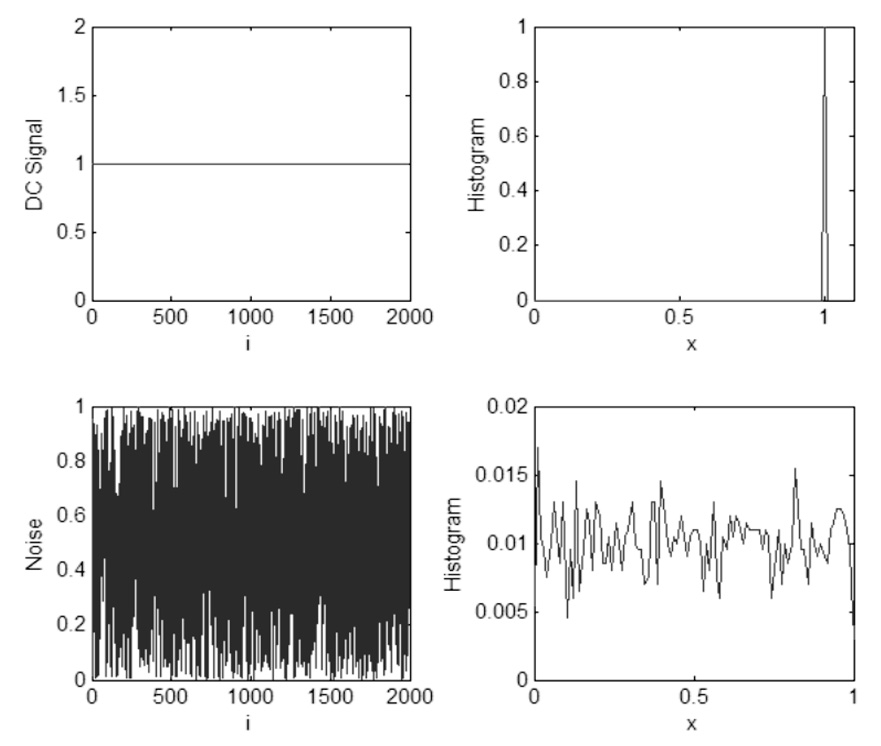
Figure 2.
This illustrates two test signals: a DC signal and an independent uniformly distributed random noise sequence. 2000 sample points were processed for each case. The label ‘i’ in the first column represents the sample number of the signal. The label ‘x’ in the second column shows the possible values the given time series can take on as explained above. The y axis shows the probability of occurrence of the corresponding x value. Shannon Entropy is computed from these values as explained.

