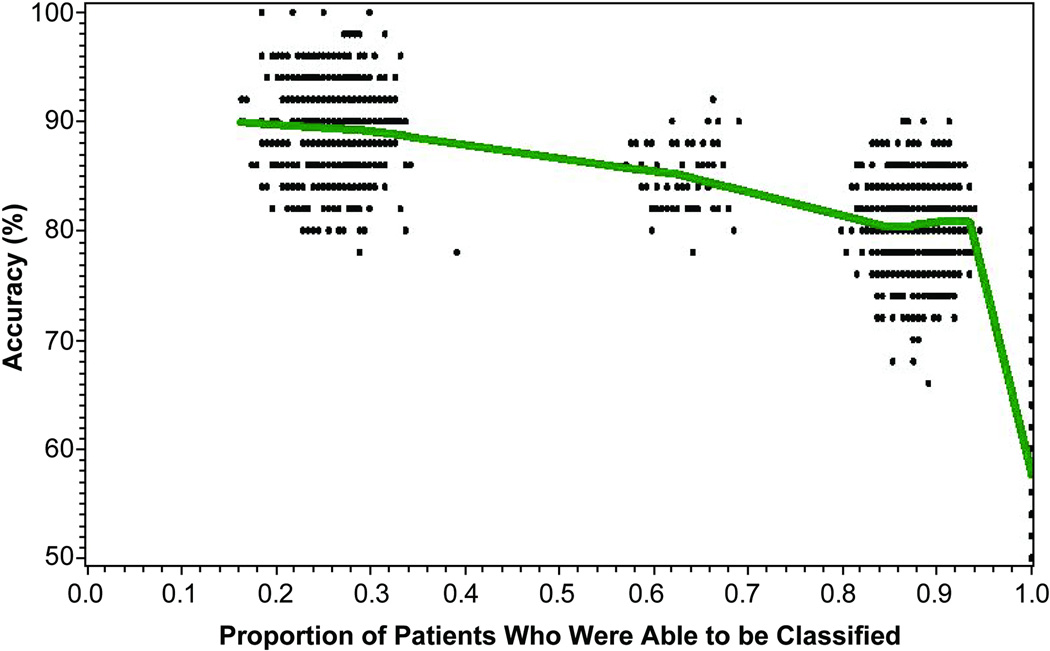
Figure 4.
Application of prediction model shown in Figure 1A to 1000 bootstrap samples of TEMPO patients receiving etanercept plus methotrexate (n = 193 patients in each sample, sampled with replacement). The accuracy required of the prediction model was iteratively varied at set threshold levels between 50% and 100%. Each data point represents the proportion of each bootstrap sample that could be classified with that amount of accuracy, and a Loess curve line was fitted through the data points. This simulated model illustrates the tradeoff of misclassification rate versus the proportion of patients who can be classified with the prediction model. With the requirement for greater accuracy (left-hand side of figure), fewer patients could be classified at week 12.

