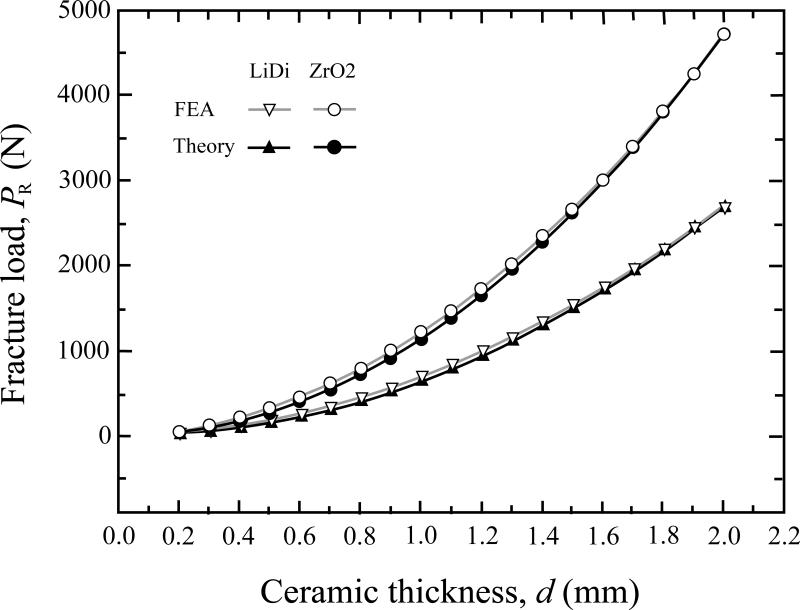
Figure 4.
Comparison of ceramic fracture load versus thickness relationship generated by FEA simulation and theoretical analysis. Ceramic plates of various thicknesses were bonded to dentin and loaded at the top surface with a rigid indenter. Open symbols: FEA generated data; solid symbols: theoretical predictions. Triangles: lithium disilicate (LiDi); circles: zirconia (ZrO2).

