Figure 2.
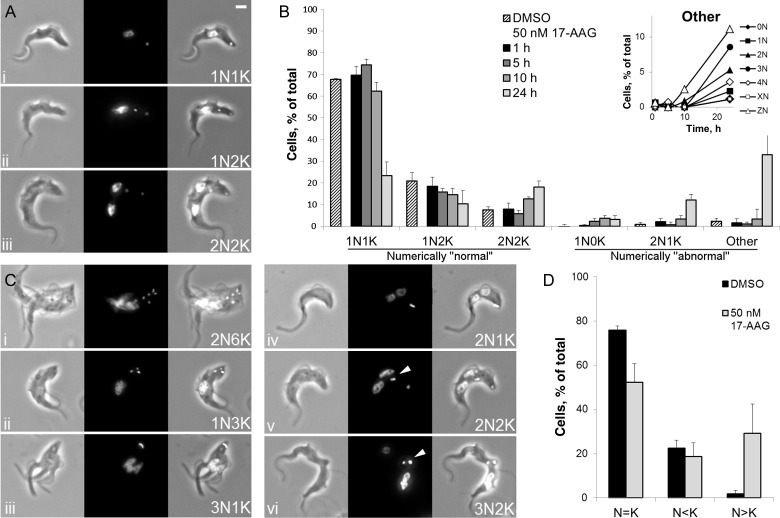
Analyses of trypanosome nuclear and kinetoplast content by DAPI staining and fluorescence microscopy. A, Examples, as indicated, of normal 1 nucleus and kinetoplast (1N1K) cells, 1 nucleus and 2 kinetoplast (1N2K) cells, and 2 nuclei and kinetoplast (2N2K) cells in control cultures. Bar, 1 µm. B, Trypanosomes were treated with 50 nM 17-AAG or solvent for the indicated times and then scored for nuclear and kinetoplast content on the basis of DAPI staining. Values are the means ± SD of counts made in a blinded fashion by 3 observers. The insert shows nuclear content of other cells across time. DMSO, dimethyl sulfoxide; X, ≥5; Z, not identifiable. C, Examples of aberrant cells after 24 hours of treatment with 50 nM 17-AAG. White arrowhead, rereplicating kinetoplast. D, Analysis of data from panel B to determine the percentage of cells with a number of nuclei equal to, less than, or greater than the number of kinetoplasts.

