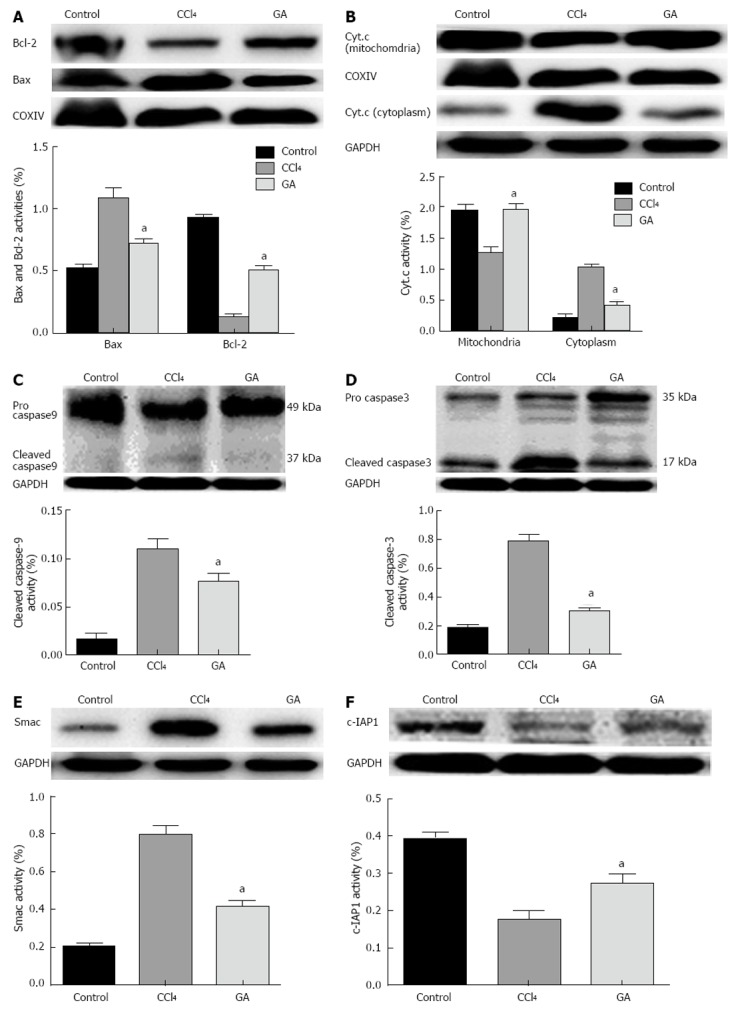
Figure 4.

Impact of glycyrrhizic acid on CCl4-treated hepatocyte apoptosis signal cascades. Protein extracts from livers in the different groups were subjected to Western blotting. A: Expression levels of Bax and Bcl-2 in the mitochondria; B: Expression levels of cytochrome C (Cyt.c) in the cytoplasm and mitochondria; C: Expression level of caspase-9 in the total protein; D: Expression level of caspase-3 in the total protein; E: Expression level of Smac in the cytoplasm; F: Expression level of c-IAP1 the total protein. In all these experiments glyceraldehyde-3-phosphate dehydrogenase (GAPDH), COXIV were used to ensure equal sample loading. The Western blotting results represent three independent tests. The bar graph represents the value of in the different proteins via the density of bands from at least three independent tests. All values are presented as mean ± SD. Statistical significant was defined as follows: aP < 0.05 vs the CCl4 group. GA: Glycyrrhizic acid; CCl4: Carbon tetrachloride.
