Figure 1.

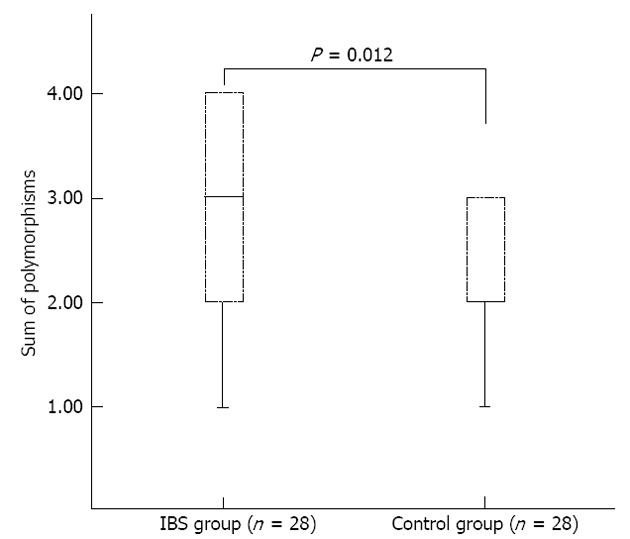
Box plots showing the interquartile range (box) and median (solid line). An increase of mitochondrial DNA polymorphisms in irritable bowel syndrome (IBS) group was observed (P = 0.012).

Box plots showing the interquartile range (box) and median (solid line). An increase of mitochondrial DNA polymorphisms in irritable bowel syndrome (IBS) group was observed (P = 0.012).