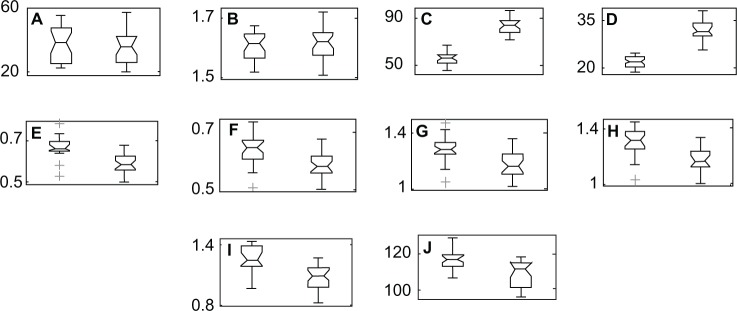
Figure 1.

Results of the estimated differences between groups. Normal weight women on the left and obese women on the right. (A) age (years), (B) height (meters), (C) body mass (kg), (D) BMI (kg/m2), (E) length of right step (meters), (F) length of left step (meters), (G) length of right stride (meters), (H) length of left stride (meters), (I) speed (meters/second), (J) cadence (steps/minute).
Note: The numbers to the left in the figure indicate the minimum and maximum values of each parameter presented.
