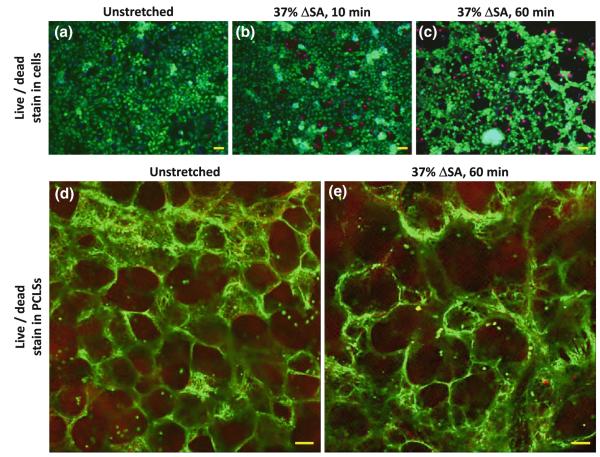
FIGURE 3.
Representative live/dead stain images for human AECs after 9 days in culture, which were then (a) remained unstretched, or stretched at 37% ΔSA for (b) 10 min, or (c) 60 min, and human PCLSs (d) left unstretched, or (e) stretched at 37% ΔSA for 60 min. Bar for AEC images = 50 μm; Bar for PCLS images = 100 μm.

