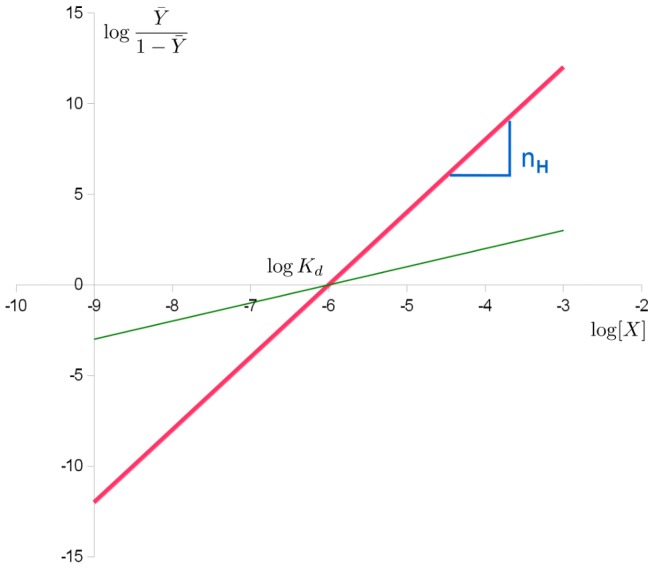
Figure 2. Hill plot of the Hill equation in red, showing the slope of the curve being the Hill coefficient and the intercept with the x-axis providing the apparent dissociation constant.

The green line shows the noncooperative curve.

The green line shows the noncooperative curve.