
Figure 2. Hill plot of the Hill equation in red, showing the slope of the curve being the Hill coefficient and the intercept with the x-axis providing the apparent dissociation constant.
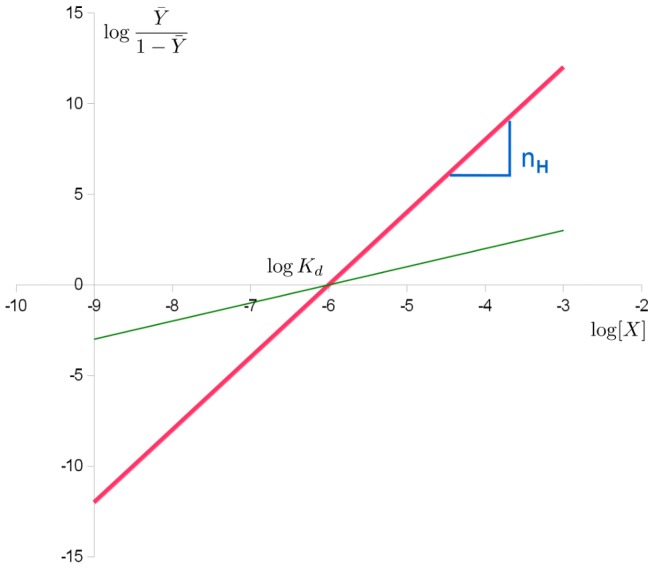
The green line shows the noncooperative curve.
Official websites use .gov
A
.gov website belongs to an official
government organization in the United States.
Secure .gov websites use HTTPS
A lock (
) or https:// means you've safely
connected to the .gov website. Share sensitive
information only on official, secure websites.
The green line shows the noncooperative curve.