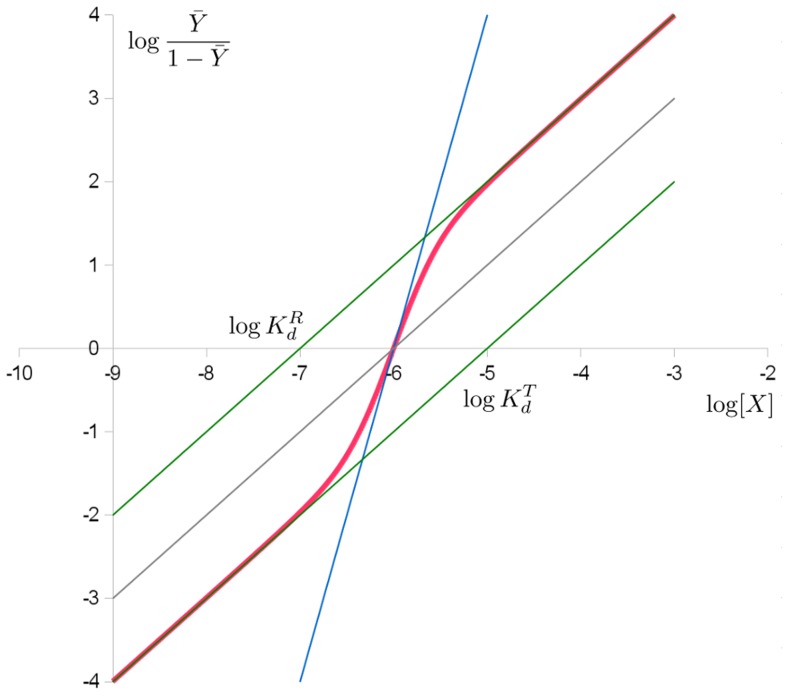
Figure 5. Hill plot of the MWC binding function in red, of the pure T and R state in green.
As the conformation shifts from T to R, so does the binding function. The intercepts with the x-axis provide the apparent dissociation constant as well as the microscopic dissociation constants of the R and T states.

