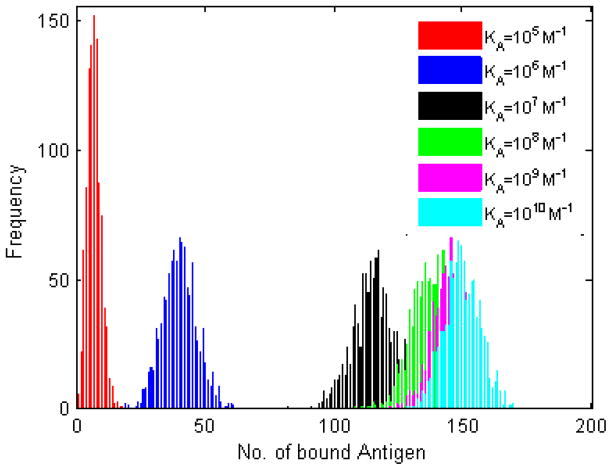
Figure 1. Histogram plots of the number of bound antigen molecules.
BCR-antigen affinity is varied by orders of magnitude across the physiological range in B cells, KA=105 M−1 to KA=1010 M−1. Because of the probabilistic nature of our simulation, one thousand trials were performed for each affinity value. The parameter values used are those listed in the left column of Table 2, simulation time is 105 time steps (corresponding to T=100 physical seconds). The number of bound antigen generally increases with affinity, as expected.

