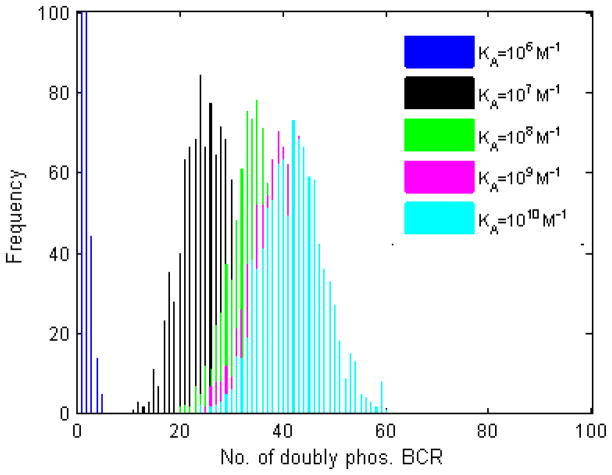
Figure 4. Histogram plots of the number of BCR molecules with at least one ITAM phosphorylated by Syk.
Included in the histograms is any BCR with at least one ITAM phosphorylated by Syk. One thousand trials, 105 time steps, with the parameters listed in the left of Table 2. As with upstream quantities, the number of Syk-phosphorylated BCR increases with affinity.

