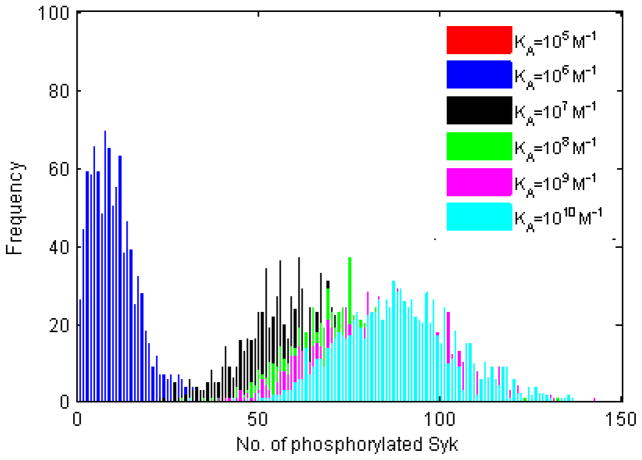
Figure 5. Histogram plots of the number of phosphorylated Syk molecules.
Includes any Syk molecule that is in the phosphorylated state, whether attached to an Ig-α/β or freely diffusing in the cytoplasm. One thousand trials, 105 time steps, with the parameters listed in the left of Table 2. As with upstream quantities, the number of twice-phosphorylated Syk increases with affinity.

