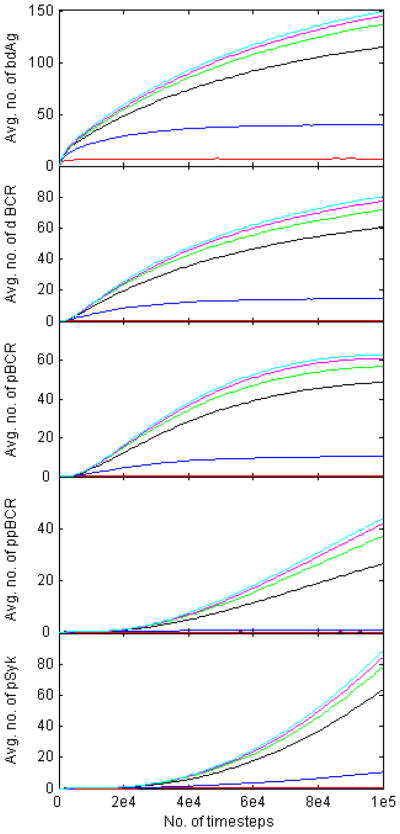
Figure 9. Plot of the mean values of the histograms in Figs. 1–5 as functions of time.

We record the mean value of the quantities plotted in Figs. 1–5 over 105 time steps, and plot the results in Fig. 9. All quantities increase monotonically with affinity, with the number of bound antigen, oligomerized BCR, and Lyn-phosphorylated BCR approaching equilibrium at T=105 time steps.
