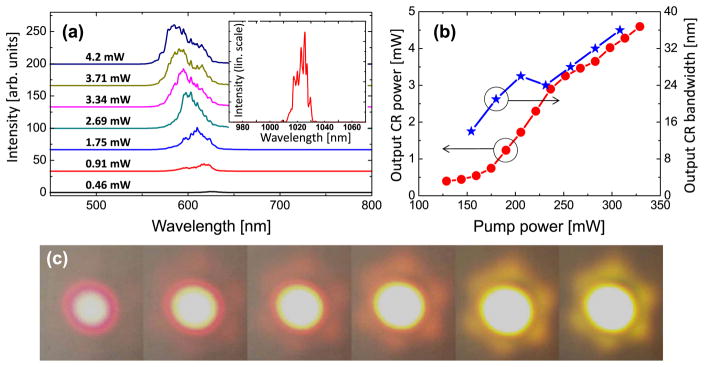
Fig. 2.

(Color online) (a) Spectra of CR at variable output power. (Inset) Spectrum of the input femtosecond pump signal. (b) Generated CR output power (red) and 3 dB bandwidth (blue) as a function of increasing pump power. (c) (From left to right) Far-field saturated VIS images of the generated Cherenkov output as the pump laser power increases from 150 to 300 mW.
