
Figure 2.
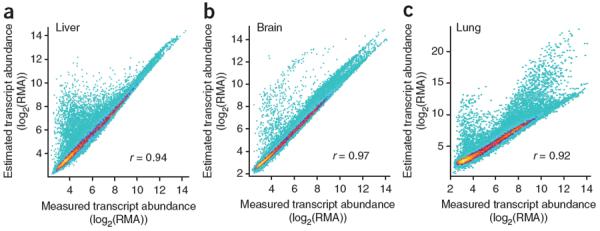
Statistical deconvolution of complex tissues yields accurate estimates of pure tissue-subset expression. (a–c) Density plots of estimated tissue-specific gene expression deconvoluted from mixed tissue samples plotted against measured gene expression from individual tissues. Color represents point density from a single probe (cyan) to 100 probes (yellow). RMA, robust multichip average.