
Figure 6.
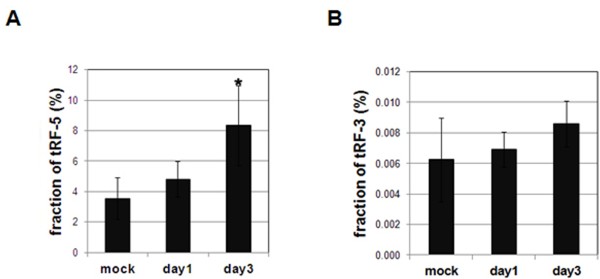
ANG cleaves tRNA to generate tRF-5 series. A and B. Fraction of tRF-5 (panel A) and tRF-3 (panel B) in the total small RNA population from mouse lungs. A relative cloning frequency of each tRF-5 (or -3) was calculated by normalizing the tRF’s read number to the total read number (as shown in Table 1). The normalized values are expressed in percentages. An average and a standard deviation were calculated from triplicate samples of each treatment.