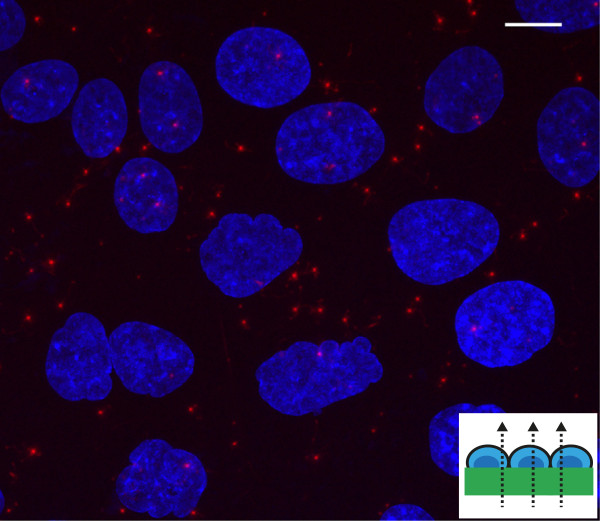
Figure 5.
Correlation between carbon ion tracks and A549 cell layer. Superposition of cellular response data (maximum intensity z-projection) with an image of the acquired FNTD image stack. The red spots are the ion tracks (with FWHM of approximately 500 nm [9]). The small trajectories branching from the ion tracks are tracks of secondary electrons in the FNTD crystal. The cell nuclei (depicted in blue) are labeled with HOECHST. The surface of cell-coated FNTD was set perpendicular to the incident carbon ion beam (small insert). Initial carbon ion energy was 270.55 MeV u −1 and fluence - 106 cm −2. Scale bar, 10 μm.

